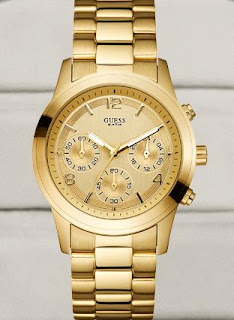
It doesn't matter where you from. We all know these products very well because we all can find them in our countries. This can only mean one thing: globalization.
Our economies, societies and cultures are each day more integrated through a global network of communication, transportation and trade.
It is really interesting that we can compare the purchasing power of different countries through the BigMac, Billy bookshelf from Ikea and ipod.
Have a look:
The Economist's Big Mac index
Bloomberg Ikea Billy bookshelf index
Country Catalogue Local Index
price (USD) Currency
========================================================
Average Price 60.09 60.09 USD 100.0
========================================================
U.A.E. 47.64 175.00 AED 79.3
U.K. 49.34 29.90 GBP 82.1
Belgium 49.91 34.95 EUR 83.1
Spain (mainland) 49.98 35.00 EUR 83.2
France 49.98 35.00 EUR 83.2
Netherlands 49.98 35.00 EUR 83.2
Portugal 49.98 35.00 EUR 83.2
Denmark 51.60 269.00 DKK 85.9
Poland 51.89 149.95 PLN 86.4
Malaysia 52.60 185.00 MYR 87.5
Hungary 52.79 9990.00 HUF 87.9
Germany 54.26 38.00 EUR 90.3
Taiwan 54.63 1795.00 TWD 90.9
Iceland 54.86 6950.00 ISK 91.3
Singapore 54.86 79.00 SGD 91.3
Sweden 55.11 395.00 SEK 91.7
Czech Republic 55.48 995.00 CZK 92.3
Ireland 55.69 39.00 EUR 92.7
Italy 55.69 39.00 EUR 92.7
Austria 55.69 39.00 EUR 92.7
Finland 55.69 39.00 EUR 92.7
Switzerland 56.24 59.95 CHF 93.6
Russia 56.59 1790.00 RUB 94.2
Slovakia 57.05 39.95 EUR 94.9
U.S. 59.99 59.99 USA 99.8
Norway 60.15 365.00 NOK 100.1
Japan 62.50 5900.00 JPY 104.0
Greece 64.26 45.00 EUR 106.9
Cyprus 64.26 45.00 EUR 106.9
Canada 64.33 69.99 CAD 107.1
Hong Kong 64.38 499.00 HKD 107.1
China 65.72 449.00 CNY 109.4
Turkey 66.49 99.00 TRY 110.7
Romania 67.28 199.00 RON 112.0
Australia (2) 74.58 89.00 AUD 124.1
Saudi Arabia 78.67 295.00 SAR 130.9
Australia (1) 79.61 95.00 AUD 132.5
Kuwait 90.28 26.00 KWD 150.2
Israel 103.48 395.00 ILS 172.2
========================================================
NOTE: Billy bookshelf, white, W80 x D28, H202 cm.
USD conversions are calculated by Bloomberg using a
30-day moving average.
(1) Victoria, East and Queensland
(2) South and West Australia
The Ipod Index
Rank 2009 | Cities | Hours of work needed to buy an iPod nano |
1 | New York | 9.0 |
2 | Zurich | 9.0 |
3 | Los Angeles | 9.5 |
4 | Sydney | 9.5 |
5 | Dublin | 10.0 |
6 | Geneva | 10.0 |
7 | Luxembourg | 10.0 |
8 | Miami | 10.0 |
9 | Montreal | 10.5 |
10 | Oslo | 10.5 |
11 | Toronto | 10.5 |
12 | Copenhagen | 11.0 |
13 | London | 11.0 |
14 | Stockholm | 11.0 |
15 | Chicago | 11.5 |
16 | Tokyo | 12.0 |
17 | Helsinki | 12.5 |
18 | Brussels | 13.0 |
19 | Amsterdam | 13.5 |
20 | Frankfurt | 13.5 |
21 | Munich | 13.5 |
22 | Berlin | 14.0 |
23 | Vienna | 14.0 |
24 | Lyon | 15.0 |
25 | Nicosia | 15.0 |
26 | Paris | 15.0 |
27 | Madrid | 15.5 |
28 | Auckland | 16.0 |
29 | Barcelona | 16.0 |
30 | Milan | 16.0 |
31 | Hong Kong | 19.0 |
32 | Lisbon | 19.5 |
33 | Rome | 19.5 |
34 | Dubai | 20.0 |
35 | Seoul | 22.0 |
36 | Tel Aviv | 22.0 |
37 | Manama | 23.0 |
38 | Taipei | 23.5 |
39 | Athens | 24.5 |
40 | Singapore | 27.5 |
41 | Ljubljana | 32.0 |
42 | Doha | 35.0 |
43 | Moscow | 36.0 |
44 | Tallinn | 39.5 |
45 | Johannesburg | 41.5 |
46 | Prague | 43.0 |
47 | Bratislava | 45.5 |
48 | Warsaw | 45.5 |
49 | São Paulo | 46.5 |
50 | Riga | 51.0 |
51 | Kuala Lumpur | 52.0 |
52 | Istanbul | 56.0 |
53 | Rio de Janeiro | 56.0 |
54 | Shanghai | 56.5 |
55 | Bogotá | 62.5 |
56 | Bucharest | 63.5 |
57 | Bangkok | 66.0 |
58 | Budapest | 68.5 |
59 | Santiago | 69.5 |
60 | Beijing | 73.0 |
61 | Vilnius | 74.5 |
62 | Sofia | 78.0 |
63 | Kiev | 82.0 |
64 | Lima | 86.5 |
65 | Jakarta | 93.0 |
66 | Mexico City | 95.0 |
67 | Caracas | 97.0 |
68 | Buenos Aires | 99.0 |
69 | Cairo | 105.0 |
70 | Delhi | 122.5 |
71 | Manila | 128.5 |
72 | Nairobi | 160.0 |
73 | Mumbai | 177.0 |


